The first quarter for Long Island’s commercial real estate market performance for 2019 is out. Here are the latest details to help keep you in the know. Arming you with details and statistics, this report includes Long Island’s retail, office, and industrial markets.
To digest this information we separate this information by the specific market and include infographics with a focus on key factors including vacancy rates, and rental rates.

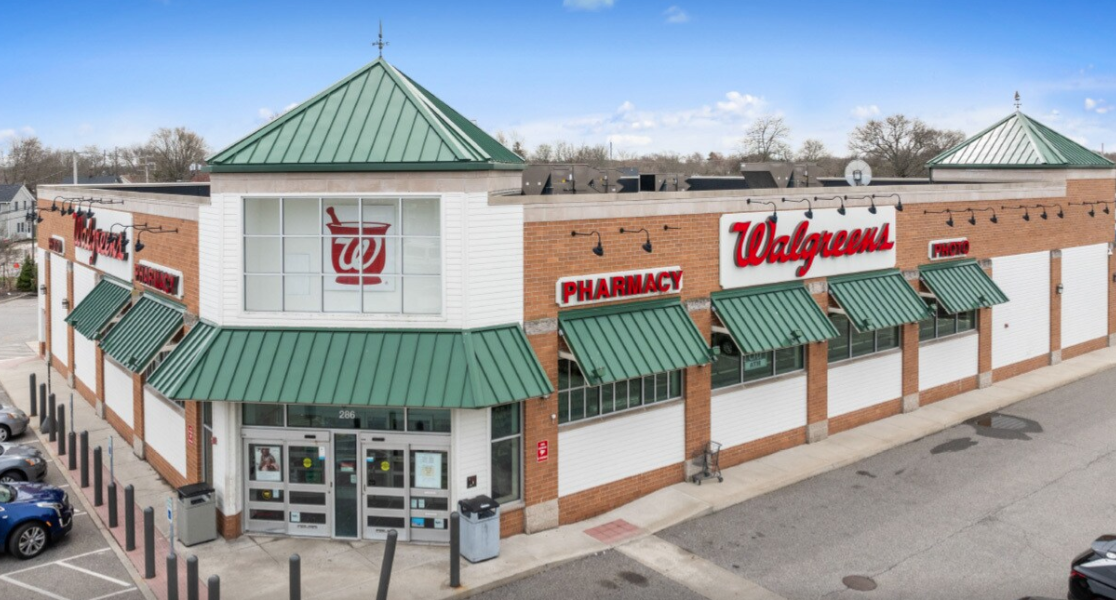
Long Island’s Commercial Real Estate Retail Market
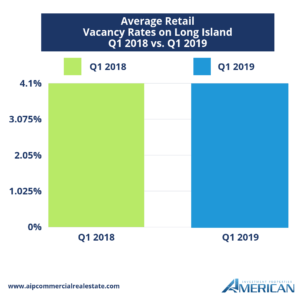
First, we examined Long Island’s commercial real estate retail market statistics. The retail market’s vacancy rate closed Q1 2019 at 4.1% – same exact rate as this time last year. This percentage includes the vacancy rates for malls, power centers, neighborhood centers, strip centers, and general retail.
While this reported rate shows a decrease from the previous quarter where rates were at 4.3%, this rate is over the 4.0% forecasted average vacancy rate for Q1 2019.
Download Graph Here
As for rental rates, they are up over the final quarter of last year with rates ending at approximately $30.00 per square foot at the close of Q1 2019. We’re continuing to see a consistent rise in rental rates in both Nassau and Suffolk Counties – signaling a strong market.
Shopping malls represent the lowest vacancy rate among the retail market types. They also show the highest rent premiums with an average rent hovering around $48 per square foot.
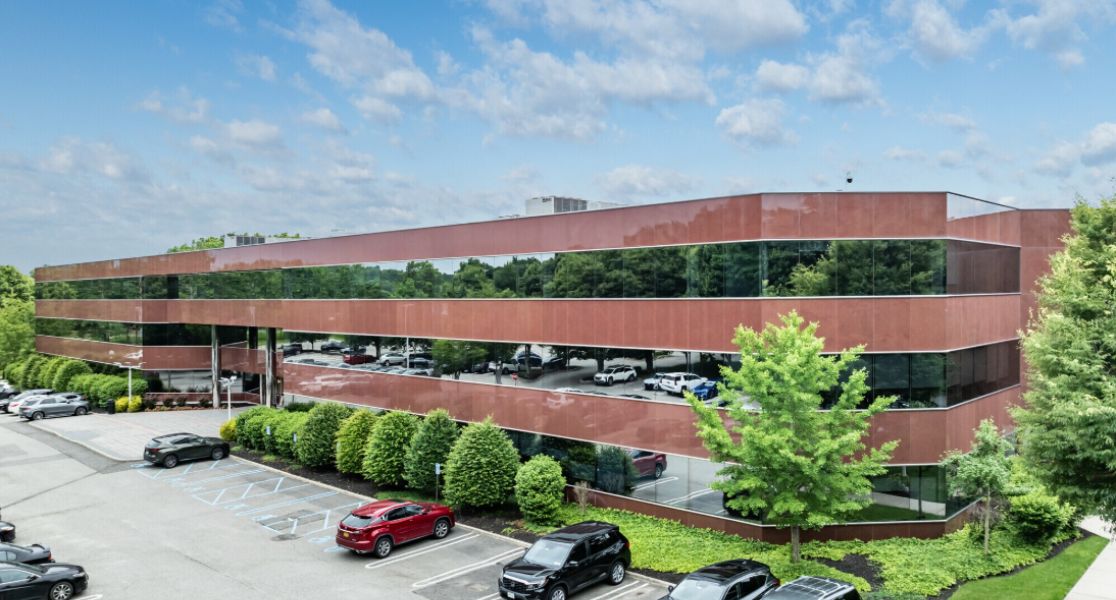
Long Island Office Market Review
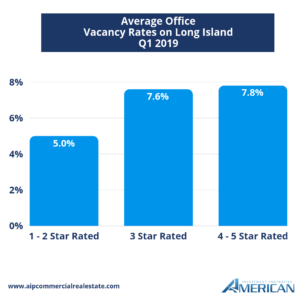
Next, a review of the Office Market statistics for the first quarter of 2019. The vacancy rate in the Nassau and Suffolk County office market, which consists of properties rated from 1 to 5 star, decreased from 7.0% at the close of 2018 to the current rate of 6.7%. This represents a 0.3% increase from this time last year, and is substantially lower than the forecasted average of 7.3%.
Vacancy rates for the specific rating segments are as follows:
– 7.8% vacancy rate for 4&5 star rated properties
– 7.6% vacancy rate for 3 star rated properties
– 5.0% vacancy rate for 1&2 star rated properties
Download Graph Here
Regarding rental rates, this number has experienced a 0.9% growth over the past 12 months ending Q1 of 2019 with an average of $28.17 per square foot in rental rates.
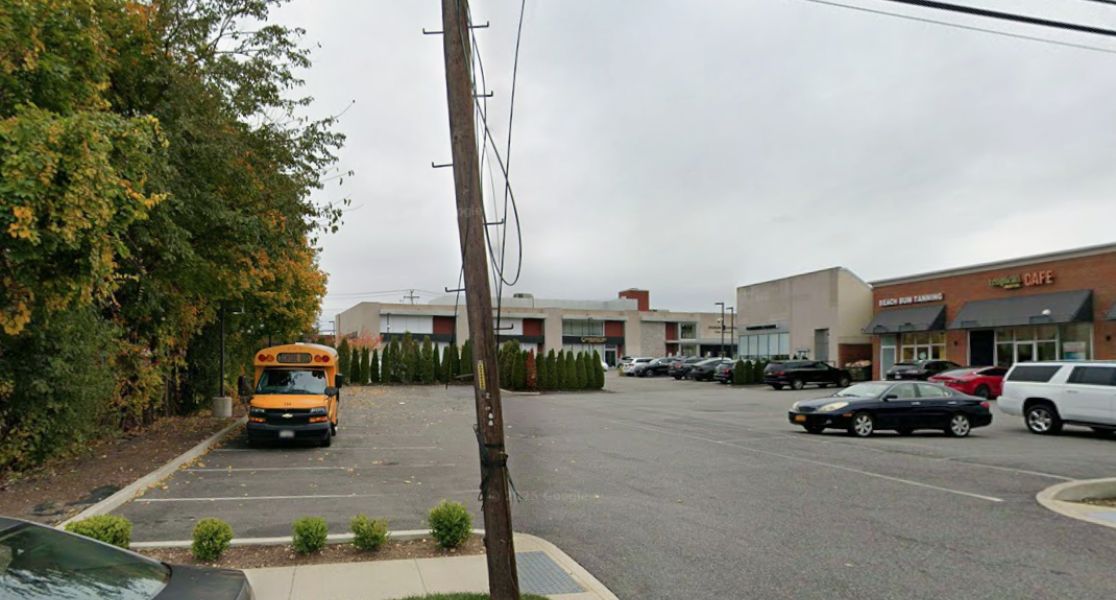
Stats for Long Island’s Industrial Market
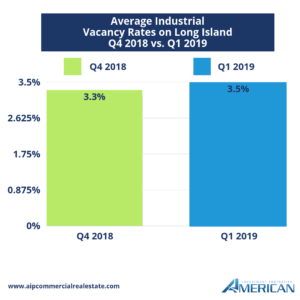
Last, we observed the statistics for Long Island’s Industrial Market. The Nassau and Suffolk County industrial market vacancy rate again has increased – this time from to 3.3% at the close of the final quarter of 2018 to 3.5% at the close of Q1 2019.
Download Graph Here
This market rate consists of vacancies from logistics properties, specialized industrial properties, and flex properties, with the highest vacancy rates in the flex space. The total average rate is up 0.5% from this time last year, yet it is significantly lower than the forecasted average of 4.1%.
As for industrial rental rates, they have increased since Q4 2018 where rates were an average of $12.13 per square foot. The average industrial market rental rates is currently at $13.19 per square foot, with highest rental rates in flex space.
 Download Graph Here