Our report on the Long Island commercial real estate market for 2019 is out. Here are the latest details we gathered of the market’s performance.
This brief market report will cover each sector: retail, multi-family, office, and industrial. It will also touch on it’s performance on sales, vacancies, cap rates, construction and more.

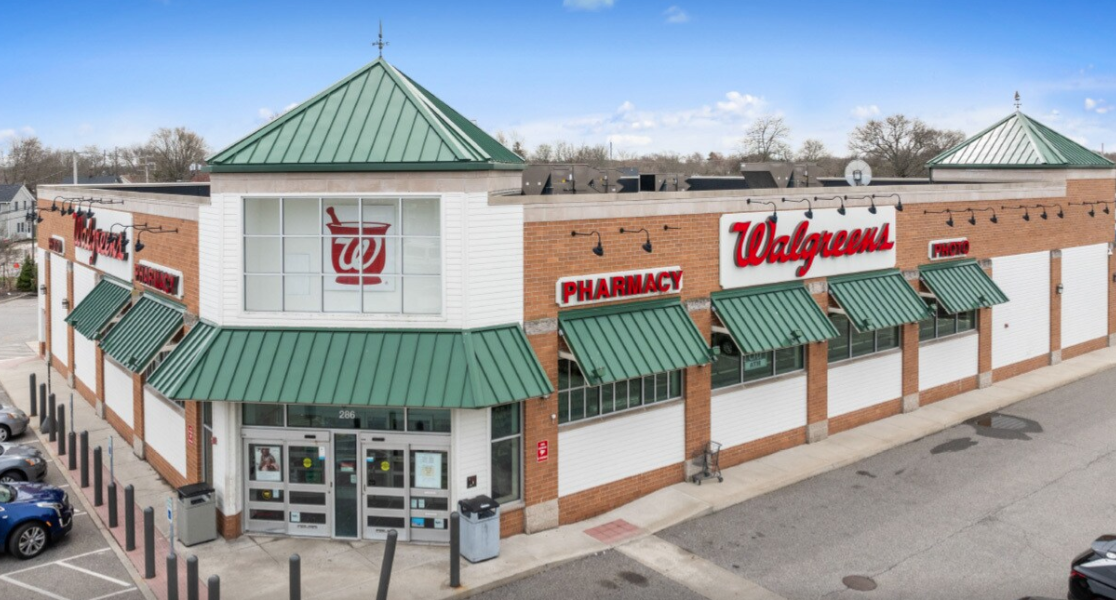
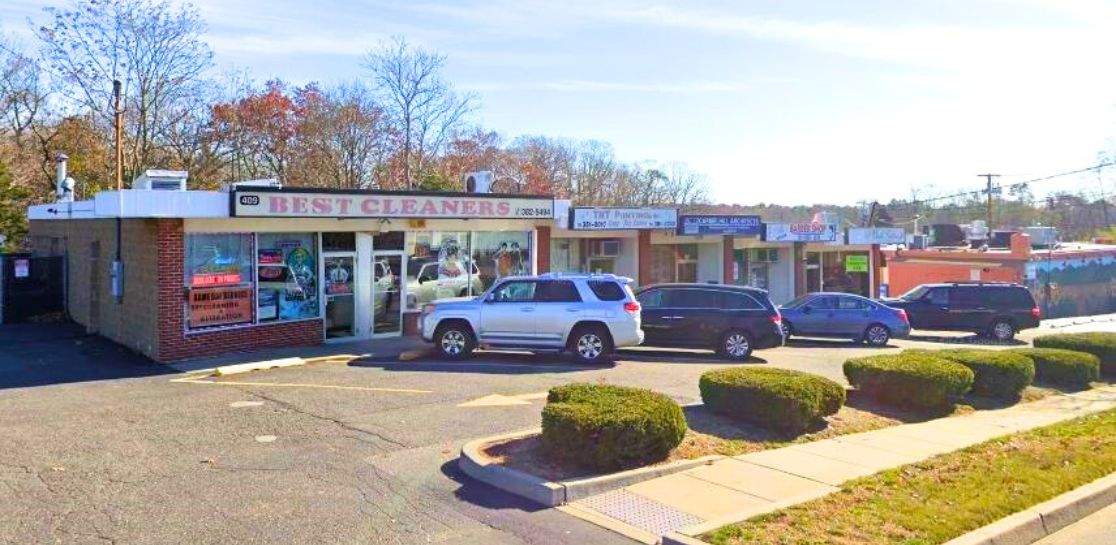
Long Island Retail Market Report
Long Island’s retail market benefits from strong demand with a limited supply. The geography of Long Island from the surrounding metros also plays an important role.
Its geography combined with limited transportation options out of the region, results in the strong demand. These forces are pushing vacancies to near record lows.
Low vacancies have also led to a spike in construction activity. Majority of the projects delivered, had a strong pre-leased tenant as the anchor. Many developers are wary of speculative projects due to the high costs of new developments.
Majority of large-scale deliveries were in Nassau County. Meanwhile, most of the future projects are in Suffolk County.
Long Island saw sales activity increase over the last few years due to the region’s fundamentals, along with higher cap rates compared to New York City.
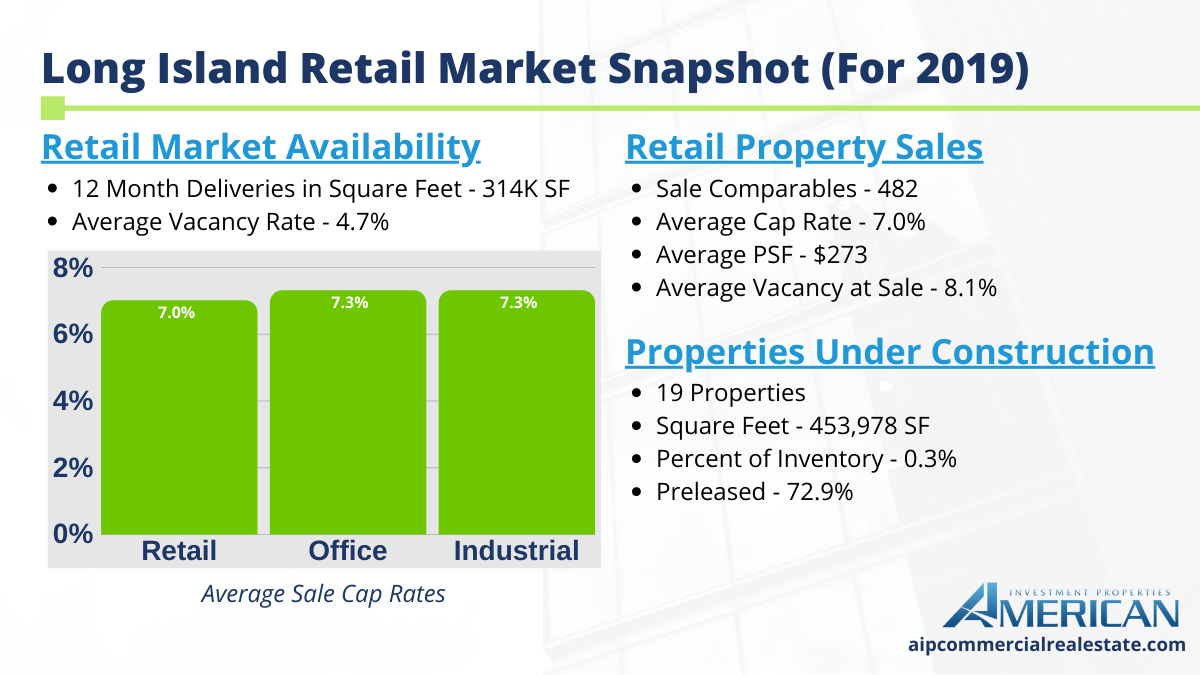
Retail Market Availability
- 12 Month Deliveries in Square Feet – 314K SF
- Average Vacancy Rate – 4.7%
Properties Under Construction
- 19 Properties
- Square Feet – 453,978 SF
- Percent of Inventory – 0.3%
- Preleased – 72.9%
Retail Property Sales (Past 12 Months)
- Sale Comparables – 482
- Avg. Cap Rate – 7.0%
- Avg. Price/SF – $273
- Avg. Vacancy at Sale – 8.1%
 Looking for retail property on Long Island? View our listings.
Long Island Multi-Family Performance
Vacancies jumped around 200 basis points in 2019 as a large supply of properties were met with less than expected demand.
Tight occupancy encouraged developers to work past the barriers to supply, high construction costs, and local opposition.
In 2019 over 1,200 new units opened. This year more than 2,000 units expect to open on the island. The supply pipeline will continue to stress occupancies, and vacancies will increase if demand can’t rebound.
Much of the demand gets its support from its proximity to New York City. A large part of deliveries are transit-oriented, next to or near Long Island rail road stations.
One example of this is Lindenhurst’s ‘The Wel’, a 260 unit- story apartment building.
Multi-family sales volume rocketed past historical averages, showing about $3 billion traded over the last 5 years. In 2019, it reached a new record with almost $900 million exchanged.
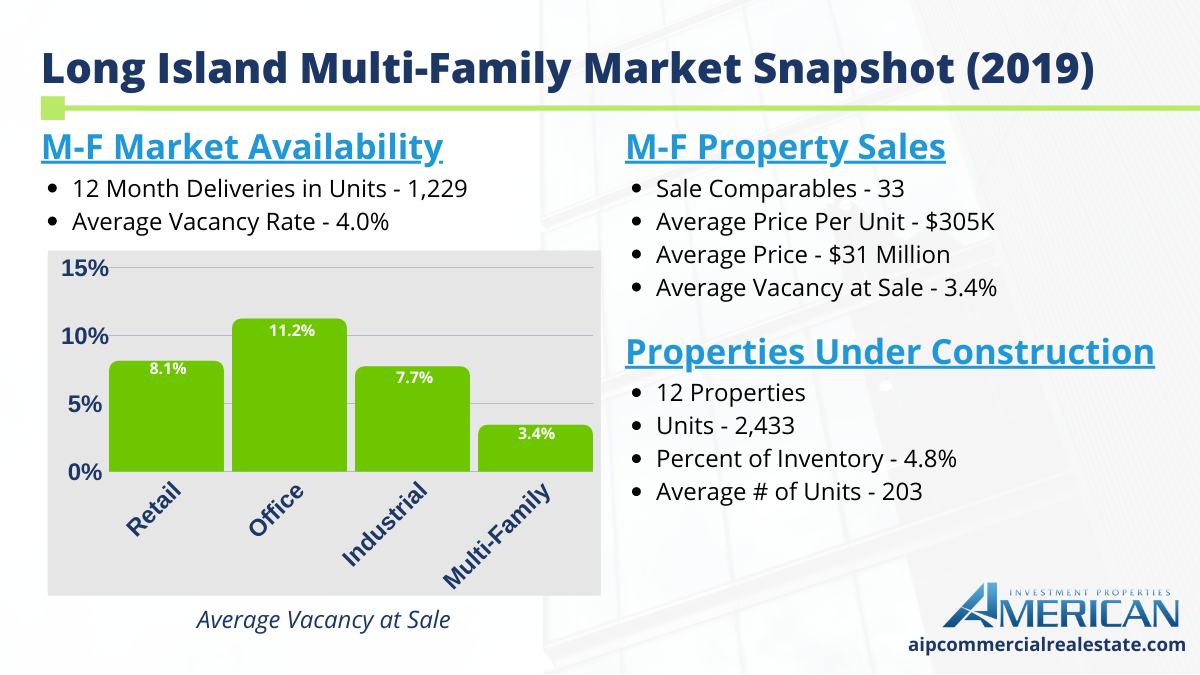
Multi-Family Market Availability
- 12 Month Delivered Units – 1,229
- Average Vacancy Rate – 4.0%
Properties Under Construction
- 12 Properties
- 2,433 Units
- Percent of Inventory – 4.8%
- Average # of Units – 203
Multi-Family Property Sales (Past 12 Months)
- Sale Comparables – 33
- Avg Price/Unit – $305 K Per Unit
- Average Price – $31 Million
- Average Vacancy at Sale – 3.4%
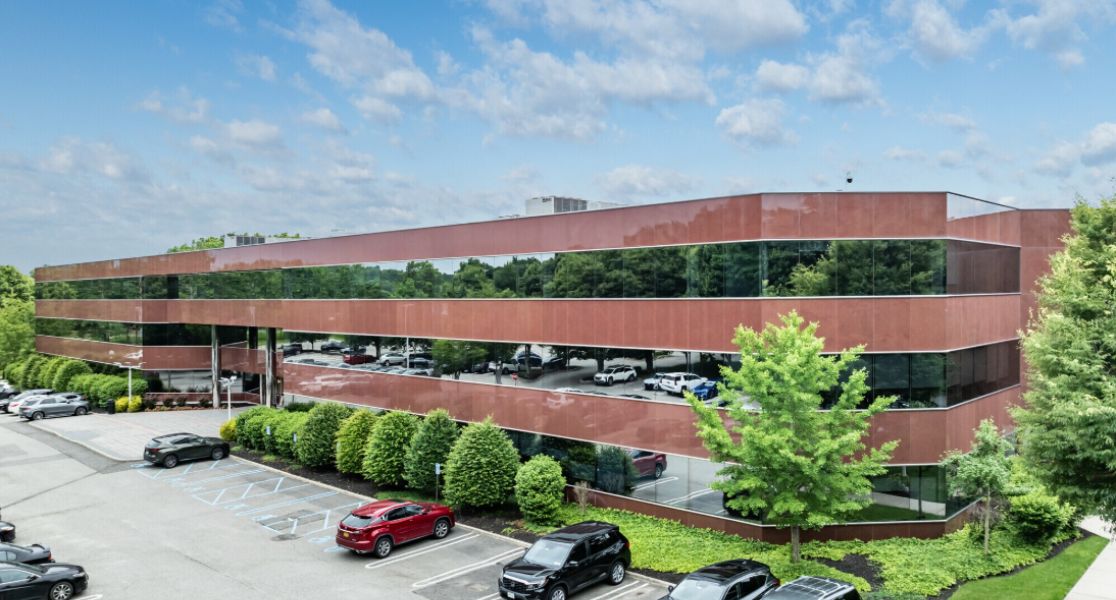
Long Island Office Market Report
Office properties on Long Island focus on accessibility for companies and residents alike. Prime inventories are concentrated along major roadways and transportation hubs.
Office vacancies have declined by almost 300 basis points since 2014, helping annual rent growth. Since 2015, there has been a deceleration of growth. For 2019, the rents have grown under 1%.
The slowdown in rents have negatively affected selling prices. Despite that, investment remains robust as transaction volume surpassed $500 million over the last four years.
With more than $600 million traded in 2018, sales have crossed this threshold last year. 2019 totaled over $800 million in sales volume, reaching its highest total since 2007.
Despite the sales activity, pricing has remained flat with cap rates inching higher.
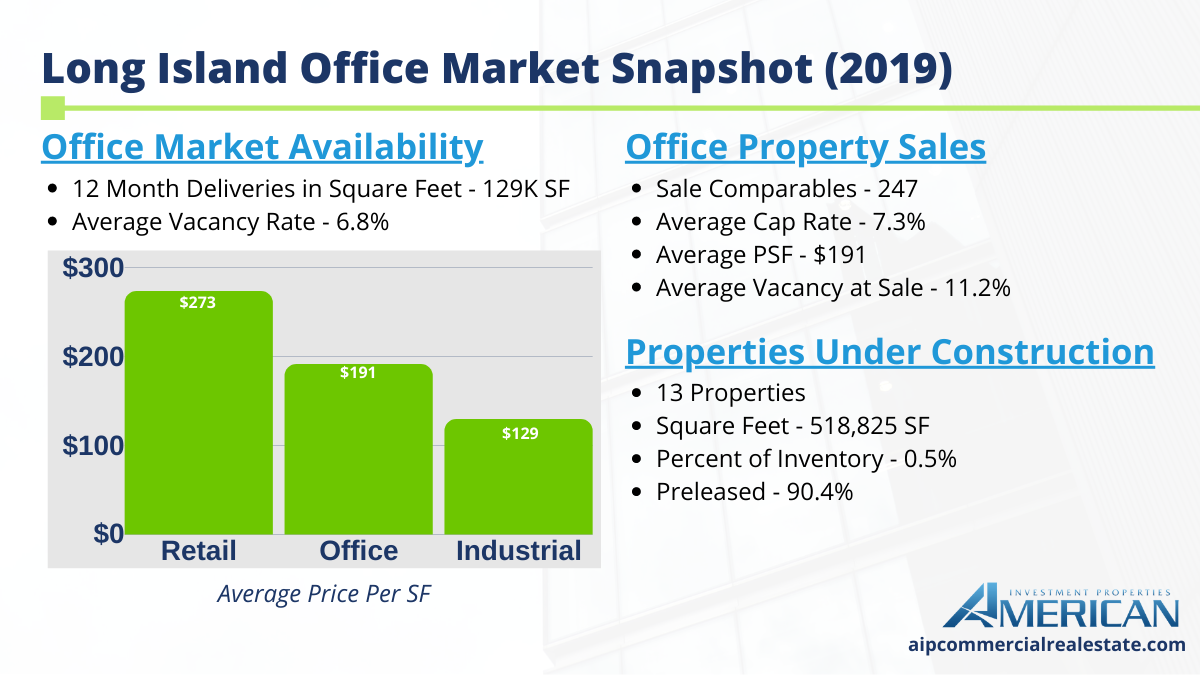
Office Market Availability
- 12 Month Deliveries in Square Feet – 129K SF
- Vacancy Rate – 6.8%
Properties Under Construction
- 13 Properties
- Square Feet – 518,825 SF
- Percent of Inventory – 0.5%
- Pre-Leased – 90.4%
Office Property Sales (Past 12 Months)
- Sale Comparables – 247
- Avg Cap Rate – 7.3%
- Avg. Price/SF – $191
- Avg. Vacancy at Sale – 11.2%
 Looking to purchase an office property on Long Island? View our listings.
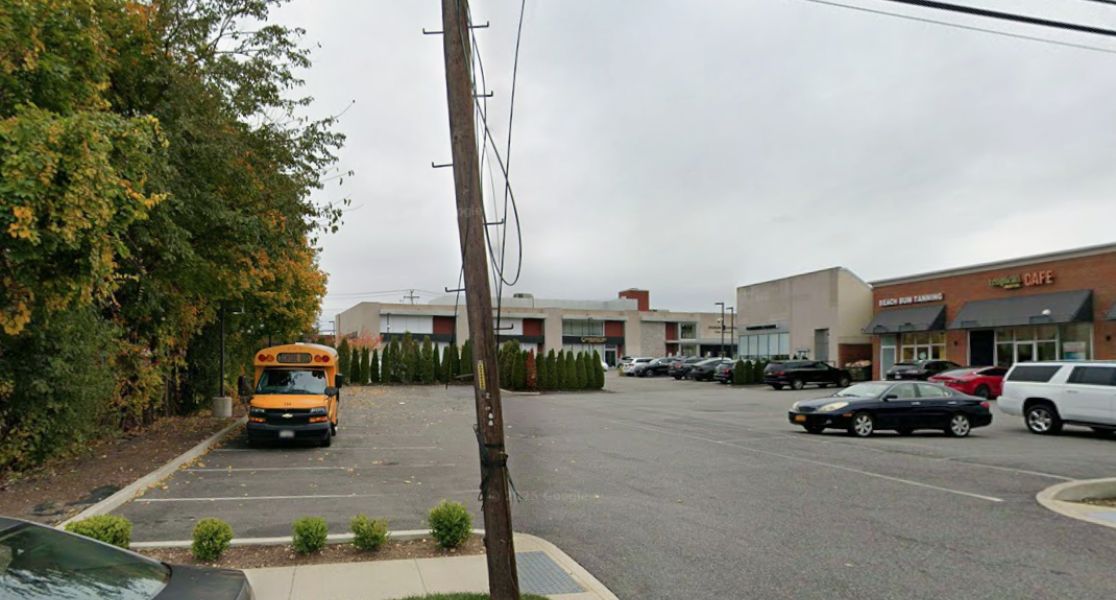
Long Island Industrial Sector
Long Island has attracted great industrial demand in recent years. Vacancies still remain below their historical average, due in part to the large-scale logistic developments.
Sales activity on Long Island is mainly comprised of owner-user transactions and some local investors. This hasn’t restricted price growth. Average prices per square foot have more than doubled since the start of the cycle.
Sales volume in 2019 reached its lowest total since 2014, with around $450 million traded.
No property sold for more than $20 million, and most transactions averaged in the $1 million to $2 million range. The most traded asset type in 2019 were low function warehouses smaller than 100,000 SF.
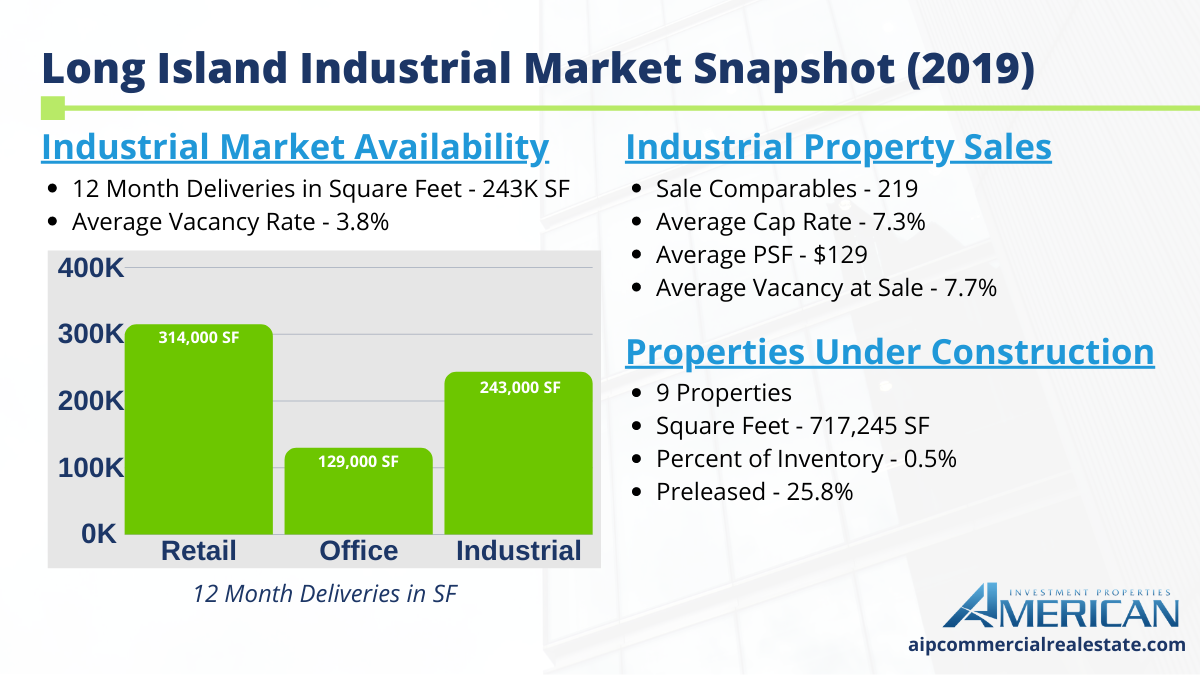
Industrial Market Availability
- 12 Month Deliveries in SF – 243K SF
- Vacancy Rate – 3.8%
Properties Under Construction
- 9 Properties
- Square Feet – 717,245 SF
- Percent of Inventory – 0.5%
- Pre-Leased – 25.8%
Industrial Property Sales (Past 12 Months)
- Sale Comparables – 219
- Avg Cap Rate – 7.3%
- Avg Price/SF – $129
- Avg Vacancy at Sale – 7.7%
Looking to purchase an industrial building on Long Island? View our listings.
![]()
Sign Up For Our Newsletter
We hope you found this Long Island market report insightful. We invite you to stay updated on the latest news and reports with our monthly newsletter. Sign up here.