Read The Latest Market Report. View Here.
Although 2018 already feels so far away it’s important to recap on fourth and final commercial real estate market performance for Long Island. Arming you with details and statistics, this report includes Long Island’s retail, office, and industrial markets. To digest this information we separate this information by the specific market and include info-graphics with a focus on three key factors: vacancy rates, rental rates, and cap rates.

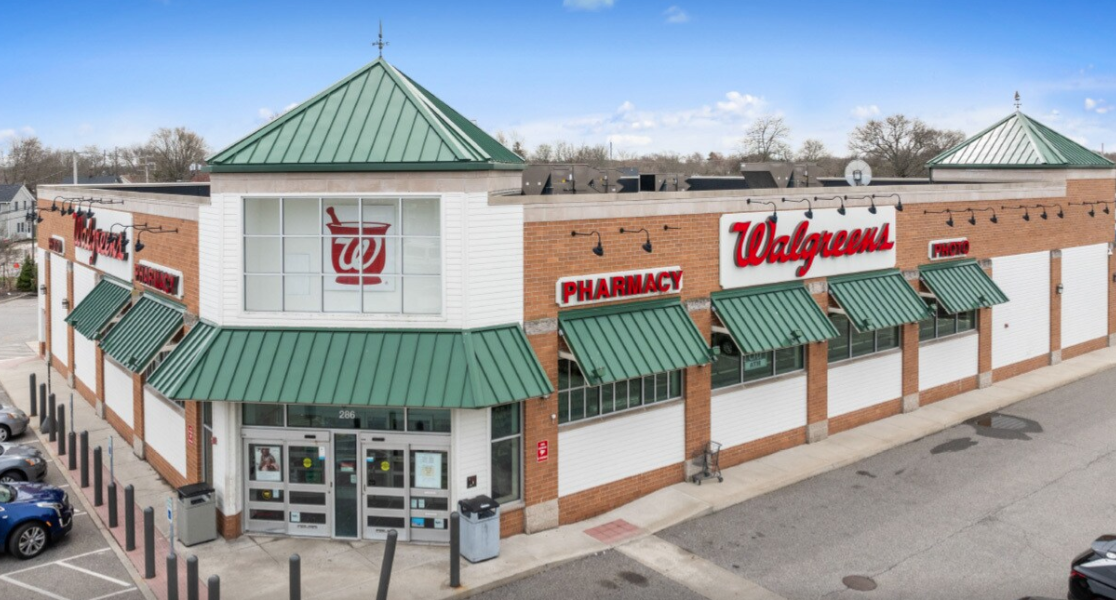
Long Island’s Retail Market Performance Overview Q4 2018
First, we examined Long Island’s retail market statistics from the final quarter of 2018. We continued to see minimal change in market conditions through the end of 2018. The year closed with the vacancy rate up over the previous quarter but still low at 4.3 percent. Over 2018, the retail vacancy rate showed increases throughout the year but remain low. As for rental rates, they were up over the previous quarter with rates ending at $27.15 per square foot at the close of Q4 2018. We’re continuing to see a consistent rise in rental rates in both Nassau and Suffolk Counties with an increase of 1.84% from the end of 2017. Regarding cap rates, the retail market cap rates had been higher in 2018, averaging 6.90% compared to the close of 2017 when they averaged 6.36%.
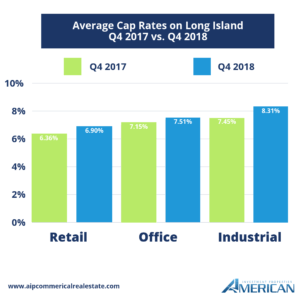
Average Cap Rates Q4 2017 vs Q4. 2018
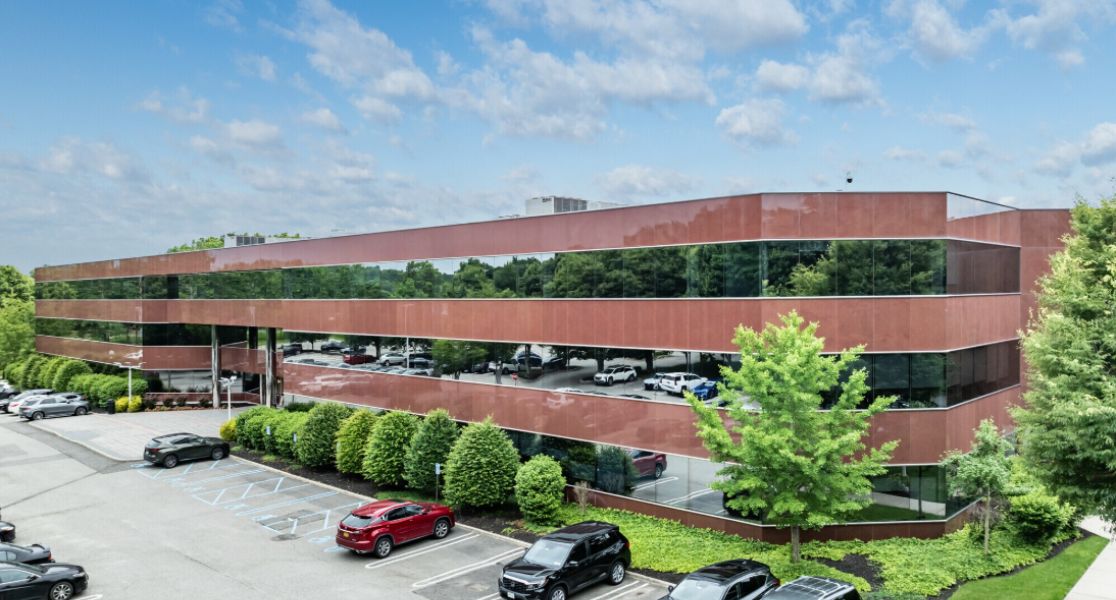
Long Island’s Office Market in 2018’s Fourth Quarter
Next, the final statistics of Long Island’s office market in 2018. The vacancy rate in the Nassau and Suffolk County office market increased from 6.8% at the close of the third quarter to 7.0% at year end, 2018. Throughout the year we saw a steady increase in the Long Island office market vacancy rate, but, as a larger picture, this rate is still low. On rental rates, the average office rental rates for Nassau and Suffolk Counties for the fourth quarter of 2018 reported at $25.11 per square foot. This rate represents a 1.3% decrease from the year’s third quarter. As for the office market cap rates, they had been higher in 2018, averaging 7.51% compared to the close of 2017 when they averaged 7.15%.
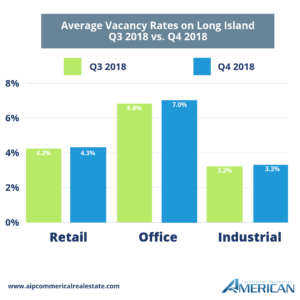
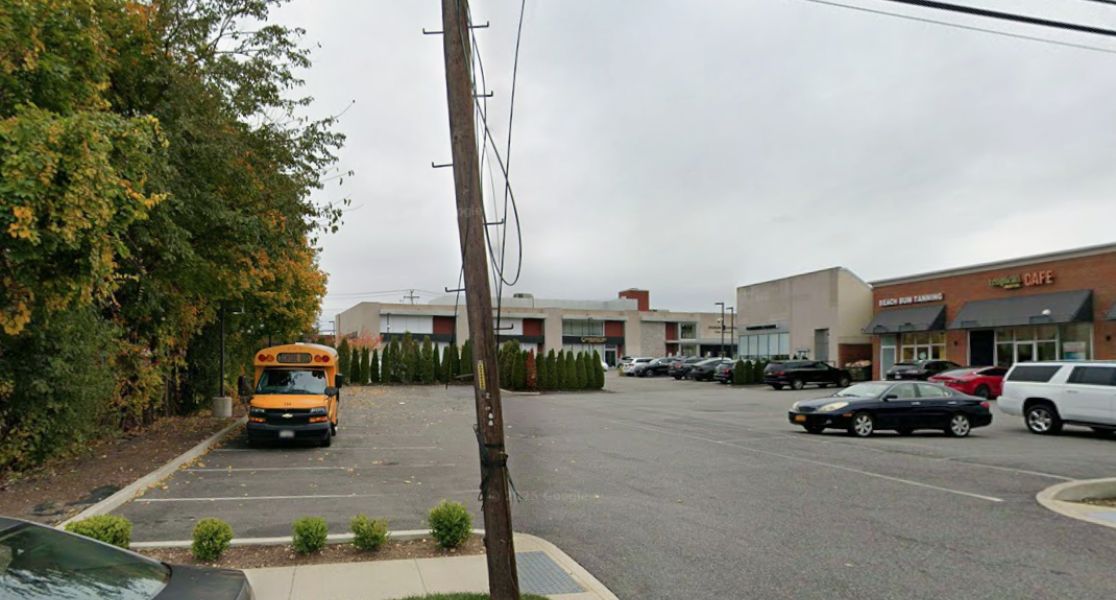
End of Year Stats for The Industrial Market
Last, a final look at 2018’s Long Island Industrial Market report. The Nassau and Suffolk County industrial market vacancy rate increased to 3.3% at the close of the final quarter of 2018, an increase from Q3 where rates were are 3.2%. Throughout the 2018 year, we continued to see steady, yet slight increases in the Industrial vacancy rate. As for industrial rental rates, they have increased since the third quarter with an average of rates at $12.13 per square foot for the year’s end. This rate represents a 1.9% increase from the third quarter reporting. Lastly, industrial market cap rates had been higher in 2018, averaging 8.31%, compared to the end of 2017 where we saw cap rates averaging at 7.45%.
Conclusion
In conclusion, the Long Island commercial real estate market did see slight yet steady increases in the vacancy rates. This was due to many factors which we explored in our blog posts throughout the year. Rental rates for the Long Island CRE Markets ebbed and flowed but never at a drastic amount. The commercial real estate market is still thriving here on Long Island.